The deprecation of the LSAT appears to continue as LSAC drops the analytical reasoning section

In 1998, a technical study from the Law School Admission Council looked at each of the three components of the LSAT—the analytical reasoning (sometimes called “logic games”), logical reasoning, and reading comprehension. The LSAT overall predicted first-year law school grade point average. But how did each of the individual components fare?

From the executive summary:

The major results of this paper indicate that each of the operational LSAT item types has a substantial correlation with FYA, and that each is needed to obtain the reported overall correlation because no two item types are perfectly correlated with each other. The item type with the greatest predictive validity was LR with a validity coefficient of 0.483. Even though RC with a validity coefficient of 0.430 had the next greatest value, AR with a validity coefficient of 0.340 makes the greater additional contribution to the validity coefficient of the entire test as it had a much lower correlation with LR than did RC. After adjusting for the amount of predictive validity accounted for by their correlations with LR, the remaining degree of correlation of AR with FYA was 0.124 whereas the corresponding value for RC was 0.107.

The results also verified that the interrelationships among the item types in the law school applicant pools were the same as those previously found for all test takers for a fixed LSAT form. The results verified that LR and RC remain very highly correlated (0.760), while AR is less correlated with LR or RC, but still strongly so, with correlations of 0.510 and 0.459, respectively.

The implications of this study are that all three item types have substantial correlations with FYA and should all remain as part of the LSAT to maintain the current level of overall predictive validity.

A few things are notable. The three sections are correlated with each other, but the analytical reasoning less so than the others. Nevertheless, the analytical reasoning section contributed significantly to the validity of the LSAT, as it was testing different skills that went into the overall predictive power of the LSAT.

Of course, none of the sections of the LSAT is a “real world” scenario for what lawyers “do,” nor does it simulate what a legal exam does. But it gets at different skills (pure logic, logic in reading, reading comprehension) that all have various applications in the first-year law school exam and the practice of law.

As I’ve been pointing out for years, however, the LSAT has been in a slow, steady decline. In 2015, I noted several problems—some from LSAC, some from the ABA, some from law schools, some from USNWR—that have resulted in the weakening the value of the LSAT. I followed up in 2017.

In 2019, LSAC entered into a consent decree on a challenge that the analytically reasoning section ran afoul of federal and state accommodations laws. Here’s what LSAC assured:

Additionally, LSAC has begun research and development into alternative ways to assess analytical reasoning skills, as part of a broader review of all question types to determine how the fundamental skills for success in law school can be reliably assessed in ways that offer improved accessibility for all test takers. Consistent with the parties' agreement, LSAC will complete this work within the next four years, which will enable all prospective law school students to take an exam administered by LSAC that does not have the current AR section but continues to assess analytical reasoning abilities.

This week, LSAC announced the conclusion of that project:

The council had four years to replace the logic games with a new analytical reasoning section under the settlement.

Because the analytical and logical reasoning sections test the same skills, it made sense to drop analytical reasoning altogether, council president Kellye Testy said in an interview Wednesday.

"This decision might help some, and it hurts none," Testy said. "The skills that we assess are the same and the scoring is the same."

In the Wednesday email to law school admissions officials, the council said removing analytical reasoning and replacing it with a second section of logical reasoning had “virtually no impact on overall scoring” based on a review of more than 218,000 exams. The revised format was also as effective as the current one in predicting first-year law school grades, the council said.

This is a remarkable conclusion for multiple reasons. First, LSAC opted not to find an “alternative,” as it originally attempted, but simply concluded it could fall back on the existing questions. Second, its conclusions run afoul of its own technical report from 25 years ago.

We shall see the LSAC new technical report, whenever it is released, as to how it the analytical reasoning section had “virtually no impact” on scoring and was “as effective” in predicting grades.

But from the existing LSAC literature, the decision to drop the analytical section will make the LSAT worse. It’s also not clear the many confounding variables that have made the LSAT worse over the years are diluting the “effectiveness” of the LSAT in its predictive power, which makes further modifications all the more marginal in terms of the effect it may have.

The hesitation I have in the title of this post, “appears,” is that I’m willing to see what LSAC puts out to explain how its 1998 study comports with its 2023 decision. But so far, I’m skeptical.
Which law schools are most aggressively pursuing admissions UGPA and LSAT medians?

I’ve long noted that USNWR’s decision to use the medians for admissions distorts how law schools behave. Law schools pursue medians at the expense of higher-caliber students who may fall just below targeted medians.

We can find ways of measuring just how aggressively law schools pursue medians. The gap from the 50th percentile to the 25th percentile of admissions metrics can show a drop-off, but that’s really only part of the story. A school can have some gap in the 50th and 25th percentiles, but it may also have a gap in the 75th and 50th, suggesting some reasonable spread among incoming students. Instead, what interests me is how close the gap is between the 75th and 50th, compared to the gap between the 50th and 25th.

Suppose a law school has incoming LSAT scores of 165, 160, and 155 as the 75th, 50th, and 25th percentiles. (This is distorted somewhat because there are more 155s than 165s, so it’s a reason I’ll use LSAT percentiles below in a moment.) That would suggest some fair distribution among the class. Suppose instead it’s a 163, 160, 153. You’ll see the median is closer to the 75th percentile, but the 25th percentile drops of somewhat. It would be in line with my explanation of some distortion in admissions—school preferring students who may have a lower LSAT but a higher GPA, which distorts the 25th percentile. Now suppose it’s 162, 160, and 150. We see tight compression at the 75th and 50th percentiles, consistent with awarding merit scholarships to aggressively pursue a target median LSAT; and a big drop-off in scores at the tail end of the class.

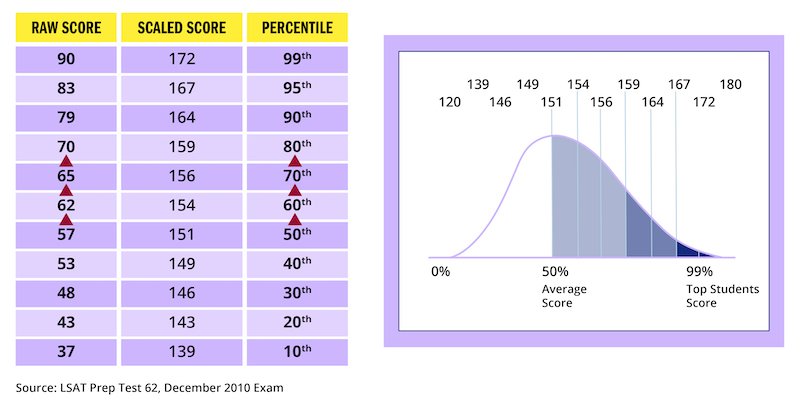
Now, the distribution of LSAT scores is something of a bell curve. The average score is around a 150 on the 120-180 scale. Most scores are clustered in the middle. Fewer and fewer applicants get more and more elite scores. The 155-159 LSAT test score band has around twice as many applicants as the 170-174 band. LSAC application data bears this out. In the 2023 cycle, there were 1661 applicants who had a 155-159 test score. There were 1437 with a 160-164.. That dropps to 1187 for a 165-169. And it’s just 964 with a 170-174, and 365 with a 175-180. This graphic from Kaplan helps show the distribution among scores (a separate way of looking at the data from the applicant profiles):

As I’ve noted elsewhere, a median-chasing strategy is likely to have much lower returns in the future if the new USNWR methodology stays in roughly the same place. Admissions statistics have much lower value. Outputs—including bar passage rate for all of the class, including those students with lower predictors—matter much more. We may see a significant shift in how schools approach admissions. (And that will be an interesting contrast to observe!)

Let’s start with LSAT. The figures below are the difference between the differences of the 75th and 50th percentile LSAT scores and the 50th and 25th percentile LSAT scores (LSAT scores roughly converted to their own percentiles). (I limited this to schools with the top 80 or so overall medians.)

Georgia: 169/168/156, -30.8

St. John’s: 164/162/154, -22.5

Arizona State: 168/167/158, -21.4

Wisconsin: 167/165/157, -19.8

Wayne State: 163/161/154. -19.7

Case Western: 162/160/153, -19.6

Drexel: 161/159/152, -19.4

George Mason: 167/166/158, -19.3

American: 163/162/156, -17.5

Penn State Law: 163/162/156, -17.5

Georgia leads the way—with a 169/168/156, this is really no surprise and maybe one of the more dramatic ones. St. John’s (164/162/154) and Arizona State (168/167/158) are also high on the list.

A few other scores had large numerical LSAT score gaps but were lower on percentile differences. Emory (169/168/ 161, -13.6), Vanderbilt (170/170/163, -12.1), Florida (170/169/162, -12) and Washington University in St. Louis (173/172/164, -10.6) all had gaps of 6 or 7 points in raw scores, but the percentiles of those scores were higher.

I’ll offer a visualization of this one to get a sense of the spread. Note that these LSAT percentiles are approximated, but the LSAT scores are listed to give a sense of the compression of scores near the top of the band.

You can see that these schools have a highly compressed 75th and 50th percentile, and then a large gap to the 25th percentile of the class.

We can also flip the list—which schools have the even distributions (and, for a few schools, closer 50th-25th gaps than 75th-50th)?

Hawaii: 160/156/154, +6.7

Kentucky: 160/157/155, +3.2

Cincinnati: 161/158/156, +2.2

Iowa: 165/163/161, -0.1

Columbia: 175/173/171, -0.3

Texas Tech: 160/157/154, -0.5

Syracuse: 160/157/154, -0.5

Cornell: 174/172/170, -0.5

Loyola-Chicago: 161/159/157, -0.6

Stanford: 176/173/170, -0.9

Schools like Columbia, Cornell, and Stanford are impressive on this front (and Yale is 11th on the list at -1.3) for having such close distributions from the 75th to the 25th, despite how few students have such high LSAT scores.

When we visualize it, we can see how much more evenly distributed the classes are from top to bottom:

You can see the stark contrast among these schools to the schools above.

Over to UGPA:

Washington University in St. Louis: 4.0/3.94/3.43, -0.45

Arizona State: 3.94/3.85/3.42, -0.34

Texas A&M: 3.98/3.93/3.54, -0.34

Wayne State: 3.89/3.8/3.38, -0.33

Florida: 3.97/3.9/3.52, -0.31

Richmond: 3.87/3.75/3.33, -0.3

Drexel: 3.82/3.72/3.33, -0.29

Indiana-Bloomington: 3.92/3.81/3.42, -0.28

George Mason: 3.93/3.83/3.45, -0.28

Chapman: 3.78/3.63/3.2, -0.28

Three schools (Arizona State, Wayne State, and George Mason) make both lists. (As noted, Washington University in St. Louis and the University of Florida have fairly large LSAT spreads, but that did not translate to percentile differences.)

Now on the flip side, most balanced incoming class based on UGPA metrics:

Iowa: 3.83/3.66/3.49, 0

Mississippi: 3.81/3.54/3.27, 0

Stanford: 3.99/3.92/3.84, -0.01

Oregon: 3.76/3.57/3.37, -0.01

Stetson: 3.73/3.51/3.28, -0.01

Columbia: 3.95/3.87/3.78, -0.01

Yale: 3.99/3.94/3.87, -0.02

Berkeley: 3.9/3.83/3.74, -0.02

Cincinnati: 3.91/3.73/3.52, -0.03

Loyola-Chicago: 3.72/3.56/3.37, -0.03

Harvard: 3.99/3.92/3.82, -0.03

Duke: 3.84/3.85/3.73, -0.03

We see some of the same schools (Cincinnati, Columbia, Iowa, Loyola-Chicago) make both lists here, too.

It’s pretty stark to see some of the disparities in the gaps of how UGPA percentiles fill out a class. Washington University (4.0/3.94/3.43) has a higher 50th percentile than Iowa’s (3.83/3.66/3.49) 75th percentile, but it has a lower 25th percentile.

Recall, the metric here is not about the “best” or “worst” schools. It’s meant simply to display the disparities in how schools treat the delta between the 75th and 50th percentiles, and the 50th and 25th percentiles, in their incoming classes.

There’s no question that schools have widely divergent approaches to “chasing” the median. Some schools are much more aggressive, on one or both metrics, than others. And others are much more aggressive about ensuring “balance” in the class—it’s doubtful that schools with fairly “balanced” classes on both metrics get there by accident. Those more balanced classes (especially on the LSAT metric) are more likely (contingent on many other factors) to see more long-term success on the bar exam, relatively speaking. But there are many other factors at play that complicate this. And many other factors that could affect matters like academic dismissals, scholarship retention, employment outcomes, and the like.

It will be illuminating to see if the median “chasing” diminishes in light of new rankings metrics. But it’s certainly something I’m watching.

USNWR incorporates faculty citations, graduate salary, debt data into its college metrics--will law schools be next?

USNWR has many rankings apart from its graduate school (and specifically law school) rankings, of course. (One of my favorites is its ranking of diets.) Its collegiate rankings have been around for a long time and have been influential, and because it is a higher education ranking, it is useful to see what USNWR is doing with it in case it portends future changes elsewhere.

USNWR has bifurcated some of its methodology. For “national universities,” it uses some different factors from other schools it ranks. (Law schools are all ranked together in one lump.) And this year included three notable changes in some or all of the rankings—notable, for this blog’s purposes.

First, debt.

Borrower debt: This assesses each school's typical average accumulated federal loan debt among only borrowers who graduated. It was sourced from the College Scorecard, a portal of higher education data administered by the U.S. Department of Education.

. . .

In previous editions, the data was sourced from U.S. News' financial aid surveys and assessed mean debt instead of median debt. There are two reasons behind this change. One is that 50th percentile amounts are more representative than average amounts because they are less impacted by outliers. The other is that College Scorecard's data is sourced from its department's National Student Loan Data System (NSLDS), which keeps records of federal loan disbursements and therefore is a more direct source of information than school-reported data.

As readers of this blog know, I’ve long used similar metrics for law schools on this blog and have found them useful. And readers may recall that USNWR used to collect debt data; incorporated it in the last two years’ of rankings; and then stopped this year with the rise of the “boycott.” Law schools stopped voluntarily reporting indebtedness. So USNWR dropped it for only publicly available information.

The College Scorecard is publicly available. It offers this debt data for USNWR to use. Will USNWR incorporate it in next year’s rankings? It remains a distinct possibility, as the note above suggests.

Second, citations.

To be grouped in the National Universities ranking, an institution must be classified in the Carnegie Classifications as awarding doctorate-level degrees and conducting at least "moderate research." In alignment with these schools' missions, U.S. News introduced four new faculty research ranking factors based on bibliometric data in partnership with Elsevier. Although research is much less integral to undergraduate than graduate education – which is why these factors only contribute 4% in total to the ranking formula – undergraduates at universities can sometimes take advantage of departmental research opportunities, especially in upper-division classes. But even students not directly involved in research may still benefit by being taught by highly distinguished instructors. Also, the use of bibliometric data to measure faculty performance is well established in the field of academic research as a way to compare schools.

Only scaled factors were used so that the rankings measure the strength and impact of schools' professors on an individual level instead of the size of the university. However, universities with fewer than 5,000 total publications over five years were discounted on a sliding scale to reduce outliers based on small cohort sizes, and to require a minimum quantity of research to score well on the factors. The four ranking factors below reflect a five-year window from 2018-2022 to account for year-to-year volatility.

Citations per publication is total citations divided by total publications. This is the average number of citations a university’s publications received. The metrics are extracted from SciVal based on Elsevier’s Scopus® Data.

Fields weighted citation impact is citation impact per paper, normalized for field. This means a school receives more credit for its citations when in fields of study that are less widely cited overall. The metrics are extracted from SciVal based on Elsevier’s Scopus® Data.

The share of publications cited in the top 5% of the most cited journals. The metrics are extracted from SciVal based on Elsevier’s Scopus® Data.

The share of publications cited in the top 25% of the most cited journals. The metrics are extracted from SciVal based on Elsevier’s Scopus® Data.

Each factor is calculated for the entire university. The minority of universities with no data on record for an indicator were treated as 0s. The Elsevier Research Metrics Guidebook has detailed explanations of the four indicators used.

Elsevier, a global leader in information and analytics, helps researchers and health care professionals advance science and improve health outcomes for the benefit of society. It does this by facilitating insights and critical decision-making for customers across the global research and health ecosystems. To learn more, visit its website.

USNWR had considered using citation metrics from Hein for law school rankings years ago. I tried to game it out to show how it may not change much, as it was fairly closely related to overall peer score, but that it could affect how the overall rankings look because of the gap in citation metrics as opposed to peer score. But like Hein, here USNWR outsourced the citations to Elsevier’s Scopus.

I do not know if USNWR would choose to use Scopus (which has a much smaller set of legal citations than other databases. (I believe Scopus records less than 10% of the citations that Westlaw and Google Scholar have for my work, as one example.) But USNWR’s willingness to engage with scholarship for national universities suggests it might consider doing the same for law schools. Of course, law schools are ranked together, as opposed to “research” law schools and “teaching” law schools, for lack of better terms here.

Third, salaries.

College grads earning more than a high school grad (new): This assesses the proportion of a school's federal loan recipients who in 2019-2020 – four years since completing their undergraduate degrees – were earning more than the median salary of a 25-to-34-year-old whose highest level of education is high school.

The statistic was computed and reported by the College Scorecard, which incorporated earnings data from the U.S. Department of the Treasury. Earnings are defined as the sum of wages and deferred compensation from all W-2 forms received for each individual, plus self-employment earnings from Schedule SE. The College Scorecard documented that the median wage of workers ages 25-34 that self-identify as high school graduates was $32,000 in 2021 dollars. The vast majority of jobs utilizing a college degree, even including those not chosen for being in high-paying fields, exceed this threshold.

The data only pertained to college graduates and high school graduates employed in the workforce, meaning nongraduates, or graduates who four years later were continuing their education or simply not in the workforce, did not help or hurt any school.

U.S. News assigned a perfect score for the small minority of schools where at least 90% of graduates achieved the earnings threshold. Remaining schools were assessed on how close they came to 90%. The cap was chosen to allow for a small proportion of graduates to elect low-paying jobs without negatively impacting a school's ranking.

The ranking factor's 5% weight in the overall ranking formula equals the weight for borrower debt, because both earnings and debt are meaningful post-graduate outcomes.

This is something like the flip side of the debt question, which I’ve also written about, again from publicly available data. And it would solve some of the problems that USNWR has in conflating a lot of job categories into one, or weighting them by some arbitrary percentages.

All three are fairly interesting—and, might I say, on the whole, good—additions to the collegiate rankings. Yes, like with any metric, one can quibble about the weights given to them, and how any factors can be gamed.

But I am watching closely now to see how USNWR might incorporate factors like these in its next round of law school rankings. If that’s true, these projected rankings I offered this spring aren’t worth much.

USNWR should considering incorporating conditional scholarship statistics into its new methodology

Earlier, I blogged about how USNWR should considering incorporating academic attrition into its methodology. Another publicly-available piece of data that would redound to the benefit of students would be conditional scholarship statistics.

Law students offer significant “merit based” aid—that is, based mostly on LSAT and UGPA figures of incoming students. The higher the stats, the higher the award in an effort to attract the highest caliber students to an institution. They also offer significant awards to students who are above the targeted medians of an incoming class, which feeds back into the USNWR rankings.

Law schools will sometimes “condition” those merit-based awards on law school performance, a “stipulation” in order to retain the scholarship in the second and third years of law school. The failure to meet the “stipulation” means the loss or reduction of one’s scholarship—and it means the student must pay the sticker price for the second and third years of law school, or at least a higher price than the students had anticipated based on the original award.

The most basic (and understandable) condition is that a student must remain in “academic good standing,” which at most schools is a pretty low GPA closely tied to academic dismissal (and at most schools, academic dismissal rates are at or near zero).

But the ABA disclosure is something different: “A conditional scholarship is any financial aid award, the retention of which is dependent upon the student maintaining a minimum grade point average or class standing, other than that ordinarily required to remain in good academic standing.”

About two-thirds of law schools in the most recent ABA disclosures report that they had zero reduced or eliminated scholarships for the 2019-2020 school year. 64 schools reported some number of reduced or eliminated scholarships, and the figures are often quite high. If a school gives many awards but requires students to be in the top half or top third of the class, it can be quite challenging for all awardees to maintain their place. One bad grade or rough day during exams in a point of huge compression of GPAs in a law school class can mean literally tens of thousands of dollars in new debt.

Below is a chart of the reported data from schools about their conditional scholarship and where they fall. The chart is sorted by USNWR “peer score.” (Recall all the dots at the bottom are the 133 schools that reported zero reduced or eliminated scholarships.)

These percentages are the percentage of all students, not just of scholarship recipients—it’s meant to reflect the percentage among the incoming student body as a whole (even those without scholarships) to offer some better comparisons across schools. (Limiting the data to only students who received scholarships would make these percentages higher.)

It would be a useful point of information for prospective law students to know the likelihood that their scholarship award will be reduced or eliminated. (That said, prospective students likely have biases that make them believe they will “beat the odds” and not be one of the students who faces a reduced or eliminated scholarship.)

A justification for conditional scholarships goes something like this: “We are recruiting you because we believe you will be an outstanding member of the class, and this merit award is in anticipation of your outstanding performance. If you are unable to achieve that performance, then we will reduce the award.”

I’m not sure that’s really what merit-based awards are about. They are principally about capturing high-end students, yes, for their incoming metrics (including LSAT and UGPA). It is not, essentially, a “bet” that these students will end up at the top of the class (and, in fact, is a bit odd to award them cash for future law school performance). If this were truly the motivation, then schools should really award scholarships after the first year to high-performing students (who, it should be noted, would be, at that time, the least in need of scholarship aid, as they would have the best employment prospects).

But it does allow schools to quietly expand their scholarship budget, at the expense of current students. Suppose a school has a $5 million annual scholarship budget. That should work out to $15 million a year (three years of students at a school at any one time). But if 20% of scholarships are eliminated, that budget can drop to $13 million.

I find it difficult to justify conditional scholarships (and it is likely a reason why the ABA began tracking and publicly disclosing the data for law students). I think the principal reason for them is to attract students for admissions purposes, not to anticipate that they will perform. And while other student debt metrics have been eliminated from the methodology because they are not publicly available, this metric has some proxy to debt and has some value for prospective students. Including the metric could also dissuade the practice at law schools and provide more stable pricing expectations for students.

Law schools have an extraordinary moment to rethink law school admissions in light of USNWR methodology changes

The USNWR law rankings undoubtedly affect law school admissions decisions. A decade ago, I chronicled how law schools pursue lower-quality students (as measured by predicting first year law school GPA) to achieve higher median LSAT and UGPA scores to benefit their USNWR status.

While there is a lot of churn around the world of graduate school admissions at the moment—”test optional” or alternative testing policies, and the Supreme Court’s decision in Students for Fair Admissions v. Harvard, among other things—there’s a tremendous opportunity for law schools in light of the changes in the USNWR methodology changes. Opportunity—but also potential cost.

Let’s revisit how USNWR has changed its methodology. It has dramatically increased weight to outputs (employment and bar passage). It has dramatically decreased weight to inputs (LSAT and UGPA). Peer score also saw a significant decline.

But it’s not just the weight in those categories. It’s also the distribution of scores within each category.

The Z-scores below are from my estimated rankings for next spring. It is a mix of last year’s and this year’s data, so it’s not directly comparable. And of course USNWR can alter its methodology to add categories, change the weights to categories, or change how it creates categories.

The image below takes the “weighted Z-scores” in each quartile—the top-performing school in each category, the upper quartile, the median, the lower quartile, and the bottom. (A quartile is just under 50 law schools.) It gives you a sense of the spread for each category.

The y-axis shows the weighted values that contribute to the raw score. You’ll see a lot of compression.

At the outset, you’ll notice that the “bottom” school in each category can drop quite low. I noted earlier that the decision to add Puerto Rico’s three law schools to the USNWR rankings can distort some of these categories. There are other reasons to exclude the lower-ranking outliers, which I’ll do in a moment—after all, many schools that are in the “rank not published” category are not trying to “climb” the rankings, as they are pursuing a different educational mission.

The categories are sorted from the biggest spread to the smallest spread. (1) is “employed at 10 months.” (Note that this category turns on a USNWR formula for employment that is not publicly disclosed, so this is a rough estimate that relies heavily on the “full weight” and “zero weight” employment categories, which I’ll turn to in the next image.) (2) is next, which is first-time bar passage rate. That is a large spread, but nothing compared to employment. (3) (lawyer-judge score) and (4) (peer score) have a more modest spread quite close to one another. (5) is ultimate bar passage. Then (6) is student-faculty ratio. Only down to (7) do we get LSAT, and (8) UGPA. Note how compressed these categories are. There is very little spread from the top to bottom—or maybe more appropriate, top to lower quartile.

Let’s look at the chart another way, and this time with some different numbers. I eliminated the “bottom” and instead just left the top, upper quartile, median, and lower quartile categories. This meant the categories were slightly shuffled in a few places to show the top-to-lower-quartile spread. I then added the numbers of the schools in each category. These are not always precise as schools do not fall into precise quartiles and there can be ties, so there may be rounding.

The employment category (1) includes two figures—”full weight” jobs (full time, long term, bar passage required or JD advantage positions, whether funded by the school or not; and students in a graduate degree program), and student who are unemployed or unknown. For the quartiles, I averaged a handful of schools in the range I estimate the quartile to land to give a sense of where the school is—they are, again, not precise, but pretty good estimates. (More on these employment categories in a future blog post.)

You can see how much can change with very modest changes to a graduating student body’s employment outcomes. By shifting about 3 percentage points of a class from “unemployed” to a “full weight” job (in a school of 200, that’s 6 students), a school can move from being ranked about 100 in that category to 50.

Then you can compare, visually, that gap across other categories. Moving from 100 to 50 in employment is larger than the gap between a 153 median LSAT score and a 175 LSAT score (category (7)). It’s larger than an incoming class with a 3.42 median UGPA and a 3.95 UGPA (category (8)). It’s the equivalent of seeing your peer score rise from a 1.8 to a 2.9 (category (4)).

These are fairly significant disparities in the weight of these categories—and a reason why I noted earlier this year that it would result in dramatically more volatility. Employment outcomes dwarf just about everything else. Very modest changes—including modest increases in academic attrition—can change a lot quickly.

Now, visualizing the figures like this, I think it becomes more helpful to indicate why these weights do not particularly correlate with how one envisions the “quality” of a law school. For instance, if you are looking at the quality of a school, the rankings have become much less valuable for you to assess the quality of the institution. While this is sometimes comparing apples to oranges, I think that an LSAT median difference of 153 to 175 is much more meaningful than an employment outcome increase of 3 points. It’s one thing to say employment outcomes are 33% of the rankings. It’s another to see how they relate to other factors. Likewise, if I am a prospective employer trying to assess the quality of a school that I may not know much about, the new USNWR methodology is much less helpful. I care much more about the quality of students than these marginal changes in employment—that, recall, classify everything from a Wachtell associate position to pursuit of a master’s degree in that same law school’s graduate program as the same.

First-time bar passage rate (category (2)) matters a great deal, too. Outperforming state jurisdictions by 21 points puts you at the top of the range. Outperforming them by 10 points at the upper quartile, and by 2 points at the median. It is harder, I think, to increase your bar passage rate by 8 points compared to the statewide averages of states where graduates take the bar. But there’s no question that a “good” or “bad” year for a law school’s graduates can swing this category significantly. And again, look at how wide the distribution of scores is compared to the admissions categories in (7) and (8).

You can see ultimate bar passage (5) and its relationship to LSAT (7) and UGPA (8). Recall earlier that I blogged about ultimate bar passage rate, and how just a few more students passing or failing the bar is the equivalent of dramatic swings in admissions statistics.

The student-faculty ratio (6) is a fairly remarkable category, too. It’s probably not possible for schools to hire significant numbers of faculty to adjust this category. But given that the ratio is based on total students, schools can try to massage this with one-year admissions changes to shrink the class. (More on admissions and graduating class sizes in a future post.) (Setting aside thoughts of how adjuncts play into this ratio, of course.)

(Those last two categories on library resources and acceptance rate are largely too compressed to mean much.)

I appreciate your patience through this discourse on the new methodology. But what does this have to do with admissions?

Consider the spread in these scores. They show that focusing on outputs (employment and bar passage) matters far more than inputs. The figures here show that in numerical terms. So that means law schools need to rethink admissions (if they value USNWR rankings) as less about those two categories and more about what the incoming class will do after they graduate.

Law schools could favor a number of things over the traditional chase of LSAT and UGPA medians. Some law schools already do this. But the point of this post is to identify that it now makes sense for schools to do so if they desire to climb the USNWR rankings. Admissions centered on LSAT and UGPA are short-term winners and long-term losers. Long-term winning strategy looks at prospective students with the highest likely positive outcomes.

Some possible changes to admissions strategy are likely positive:

  • Law schools could rely more heavily on the LSAC index, which is more predictive of student success, even if it means sacrificing a little of the LSAT and UGPA.

  • Law schools could seek out students in hard sciences, who traditionally have weaker UGPAs than other applicants.

  • Law schools can consider “strengthening” the “bottom” of a prospective class if it knows it does not need to “target” a median—it can pursue a class that is not “top heavy” or have a significant spread in applicant credentials from “top” to “bottom.”

  • Law schools can lean into need-based financial aid packages. If pursuit of the medians is not as important, it can afford to lose a little on the medians in merit-based financial aid and instead use some of that money for need-based aid.

  • Law schools could rely more heavily on alternative tests, including the GRE or other pre-law pipeline programs, to ascertain likely success if it proves more predictive of longer term employment or bar passage outcomes.

There are items that are more of a mixed bag, too—or even negative, in some contexts (and I do not suggest that they are always negative, or that schools consistently or even infrequently use them that way). Those include:

  • Law schools could interview prospective students, which would allow them to assess “soft factors” relating to employment outcomes—and may open the door to unconscious biases, particularly with respect to socioeconomic status.

  • Law schools could more aggressively consider resume experience and personal statements to determine whether the students have a “fit” for the institution, the alumni base, the geography, or other “soft” factors like “motivation.” But, again, unconscious biases come into play, and it’s also quite possible that these elements of the resume redound to the benefit of those who can afford to pay for a consultant or have robust academic advising over the years to “tailor” their resumes the “right” way.

  • Law schools could look for prospective students with prior work experience as likely to secure gainful employment after graduation. But, if law schools look to students who already have law firm experience (say, from a family connection), it could perpetuate legacy-based admissions.

All of this is to say, there is an extraordinary moment right now to rethink law school admissions. USNWR may disclaim that it influences law school admissions by its methodology, but revealed preferences of law schools demonstrate that they are often driven by USNWR, at least in part. The change in methodology, however, should change how law schools think about these traditional practices. There are pitfalls to consider, to be sure. And of course, one should not “chase rankings”—among other things, the rankings methodology can shift on schools. But if it’s possible to think that there are better ways of doing admissions that have been hamstrung (in part) by a median-centric USNWR methodology, this post suggests that it is the right time to do so.

USNWR should considering incorporating academic attrition rates to offset perverse incentives in new methodology

Law school attrition is a touchy subject, and one that doesn’t get a lot of attention. Attrition comes in three categories, as the ABA labels them: academic attrition, transfers out (offset by transfers in to other schools), and “other” (e.g., voluntary withdrawal, etc.).

Academic attrition in particular is a sensitive issue. Long gone are the days of the “look to your left, look to your right” expectations of legal education. Today, the expectation is the vast majority of enrolled students will graduate with a JD.

Let’s start with the potential good of academic attrition, because most of this blog post is going to focus on the bad. If a school recognizes that a student has sufficiently poor performance in law school, academic dismissal can provides benefits. It ensures the student does not graduate unable to pass the bar exam or find gainful employment after (typically) two more years spent in education and more debt incurred (perhaps over $100,000). It can also mean that law schools are more generous in admissions policies to students who may have an atypical profile—if the student can demonstrate the ability to succeed in the first year curriculum, the school is willing to take risks on students, with an understanding that academic dismissal is available on the back end.

Even this “potential good” take has its weaknesses. It can feel like the law school is paternalistic for students who want to get a law degree. A year of law school and debt is already gone—and a law degree is dramatically more valuable than one year of legal education with no degree. Students given frank and realistic advice about their odds can make the judgment themselves, on the bar exam and employment. (Then again, schools would counter, students are unrealistic about their outcomes.)

That said, many incoming law students likely do not appreciate the similar credentials might face significantly different odds of academic dismissal—it all depends on what the law school’s institutional preferences are and how they go about dismissal, and students likely may not know that they would likely graduate if they had chosen to attend another institution.

That said, academic attrition remains rare. Last year, 41 schools have 0 students who faced academic attrition. Another 70 schools had academic attrition at less than 1% of the law school’s overall total JD enrollment.

But there are outliers. There are different ways to look at outliers. Here, I’m going to look at academic attrition among all law students as a percentage of all JD enrollment. This is a bit deceptive in the dismissal rate, because very little academic attrition happens in the second and third years. But some schools have non-trivial attrition in those years. Others have unusual categorization of what dismissal or enrollment look like. So this is designed to capture everything as best I can. It sorts the schools in this chart by USNWR peer score. (Recall, too, that 111 schools are bunched near the x-axis because they are at or near zero dismissals.) (Here, I remove Puerto Rico’s three law schools.)

Now, peer score is not the greatest way of making this comparison, but it gives some idea of what to expect in different cohorts of law schools. You can see that as the “peer score” as reported by USNWR declines, attrition rates rise.

But let’s look at it another way. We might expect academic attrition to track, in part, incoming predictors. So what about comparing it to the 25th percentile LSAT of the incoming class (i.e., the cohort at the most risk of struggling in that law school’s grade distribution)? This chart focuses exclusively on 1L attrition last year, and that incoming cohort’s 25th percentile LSAT score.

By focusing exclusively on 1Ls, we find 82 schools had 0 1L JD academic attrition last year. Zero! (A lot of the dots at the bottom of the chart reflect multiple schools.) Another 35 had academic attrition below 1%. So 117 law schools law very low, to no, academic attrition. That said, we do see outliers once again.

One might expect, for instance, California law schools to see higher attrition given the fact that the “cut score” is higher in California than most jurisdictions. But not all California schools have the same kind of attrition rates, it seems. Florida has a more modest cut score, and a few law schools here are high on the list. Virginia has a high cut score, and it has no law schools that appear to be outliers.

CJ Ryan and I pointed out in our bar exam analysis earlier this year that we found academic attrition on the whole did not affect how we would model projected bar exam success from law schools—but that a few law schools did appear to have unusually high academic attrition rates, and we cited to the literature on the robust debate on this topic (check out the footnotes in our piece!).

But to return to an earlier point, a good majority of schools (about 60%) have negligible 1L academic attrition—even many schools with relatively low incoming predictors among students. Most law schools, then, conclude that even the “good” reasons for attrition aren’t all that great, all things considered. And, I think, many of these schools see good success for their graduates in employment and bar passage.

Now, the title of this post is about USNWR. What of it?

USNWR has now done a few things that make academic attrition much more attractive to law schools.

First, it has devalued admissions statistics. It used to be that schools would fight to ensure they had the highest median LSAT and UGPA scores possible. That, of course, meant many students could enter well below the median (a reason I used the 25th percentile above) and not affect the score. But the decision to admit a non-trivial number of students below the targeted median could put that median at risk—too many matriculants, and the median might dip.

But, students at the lower end of incoming class credentials also tend to receive the fewest scholarship dollars—that is, they tend to generate the most revenue for a law school. Academic dismissal is a really poor economic decision for a law school—that is, dismissing a student is a loss of revenue (remember the earlier figure… perhaps $100,000).

USNWR previous gave a relatively high weight to the median LSAT score in previous rankings methodologies. That meant schools needed to be particularly careful about the cohort of admitted students—the top half could not be outweighed by the bottom half. That kept some balance in place.

Substantially devaluing the admissions metrics, however, which on the whole seems like a good idea, creates different incentives. Schools no longer have as much incentive to keep those medians as high. It can be much more valuable to admit students, see how they perform, and academically dismiss them at higher rates. (Previously, higher dismissal rates were essentially a strategy that placed low priority on the medians, as a smaller class with a higher median could have been more effective.) It’s not clear that this will play out this way at very many schools, but it remains a distinct possibility to watch.

Second, it has dramatically increased the value of outputs, including the bar exam and employment outcomes. Again, a sensible result. But if schools can improve their outputs by graduating fewer students (recall the bar exam point I raised above, and as others have raised), the temptation to dismiss students grows. That is, if the most at-risk students are dismissed, the students who have the lowest likelihood of passing the bar exam and the most challenging time securing employment are out of the schools “outputs” cohort.

I told you this would be a touchy subject.

So let’s get a bit more crass.

In next year’s projected rankings, I project five schools tied for 51st. What if each of these schools academically dismissed just five more students in their graduation class (regardless of size, but between 2-6% of the class for these schools)? Recall, this is a significant financial cost to a law school—perhaps half a million dollars in tuition revenue over two years. And if a school did this continually each incoming 1L class, that can be significant.

But let’s try a few assumptions. (1) 4/5 students would have failed the bar exam on the first attempt; (2) 2/5 students would not have passed the bar within two years; (3) each of these students was attached to one of the five most marginal categories of employment, spread out roughly among the school’s distribution in those categories. These are not necessarily fair assumptions, but I try to cabin them. To start, while law school GPA (and the threshold for academic dismissal) are highly correlated with first-time bar passage success, they are not perfect, so I accommodate that with a 4/5. It is less clear about persistence for re-taking the bar, so a reason why I reduced it 2/5. As for employment, it seems as though the most at-risk students would have the most difficulty securing employment, but that is not always the case, and I tried to accommodate that by putting students into a few different buckets beyond just the “unemployed” bucket.

Among these five schools, all of them rose to a ranking between 35 and 45. (Smaller schools rose higher than larger schools, understandably.) But the jump from 51 to 39, or 51 to 35, is a pretty significant event for a relatively small academical dismissal rate increase.

The incentive for law schools, then, is not only to stay small (more on that in another post)—which enables more elite admissions credentials and easier placement of students into jobs—but to get smaller as time goes on. Attrition is a way to do that.

That’s not a good thing.

Indeed, I would posit that attrition is, on the whole, a bad thing. I think there can be good reasons it, as I noted above. But on the whole, schools should expect that every student they admit will be able to successfully complete the program of legal education. Schools’ failure to do so is on them. There can be exceptions, of course—particularly affordable schools, or schools that would refund tuition after a year to a student, are some cases where attrition is more justifiable. But I’m not persuaded that those are in the majority of cases. And given how many schools manage zero, or nearly-zero, attrition, it strikes me as a sound outcome.

Publicly-available data from the ABA clearly and specifically identifies attrition, including academic attrition, in public disclosures.

I would submit that USNWR should consider incorporating academic attrition data into its law school rankings. As it is, its college rankings consider six-year graduation rates and first-year retention rates. (Indeed, it also has a predicted graduation rate, which it could likewise construct here.) While transfers out usually reflect the best law students in attrition, and “other” attrition can likely be attributed to personal or other idiosyncratic circumstances, academic attrition reflects the school’s decision to dismiss some students rather than help them navigate the rest of the law program. Indeed, from a consumer information perspective, this is important information for a prospective law student—if I enter the program, what are the odds that I’ll continue in the program?

I think some academic attrition is necessary as a check on truly poor academic performance. But as the charts above indicate, there are wide variances in how schools with similarly-situated students use it. And I think a metric, even at a very low percentage of the overall USNWR rankings, would go a long way to deterring abuse of academic attrition in pursuit of higher rankings.

Does a school's "ultimate bar passage" rate relate to that school's quality?

With a loss of data that USNWR used to use to assess the quality of law schools, USNWR had to rely on ABA data. And it was already assessing one kind of outcome, first-time bar passage rate.

It introduced “ultimate bar passage” rate as a factor in this year’s methodology, with a whopping 7% of the total score. That’s higher than the median LSAT score now. It’s also much higher than the at-graduation rate in previous methodologies (4%).

Here’s what USNWR had to say about this metric:

While passing the bar on the first try is optimal, passing eventually is critical. Underscoring this, the ABA has an accreditation standard that at least 75% of a law school’s test-taking graduates must pass a bar exam within two years of earning a diploma.

With that in mind, the ultimate bar passage ranking factor measures the percentage of each law school's 2019 graduates who sat for a bar exam and passed it within two years of graduation, including diploma privilege graduates.

Both the first-time bar passage and ultimate bar passage indicators were used to determine if a particular law school is offering a rigorous program of legal education to students. The first-time bar passage indicator was assigned greater weight because of the greater granularity of its data and its wider variance of outcomes.

There are some significant problems with this explanation.

Let’s start at the bottom. Why did first-time bar passage get greater weight? (1) “greater granularity of its data” and (2) “its wider variance of outcomes.”

Those are bizarre reasons to give first-time bar passage greater weight. One might have expected that there would be an explanation (right, I think) that first-time bar passage is more “critical” (more than “optimal”) for employment success, career earnings, efficiency, and a host of reasons beneficial to students.

But, it gets greater weight because there’s more information about it?

Even worse, because of wider variance in outcomes? The fact that there’s a bigger spread in the Z-score is a reason to give it more weight?

Frankly, these reasons are baffling. But maybe no more baffling than the opening justification. “Passing eventually is critical.” True. But following that, “Underscoring this, the ABA has an accreditation standard that at least 75% of a law school’s test-taking graduates must pass a bar exam within two years of earning a diploma.”

That doesn’t underscore it. If eventually passing is “critical,” then one would expect the ABA to require a 100% pass rate. Otherwise, schools seem to slide by with 25% flunking a “critical” outcome.

The ABA’s “ultimate” standard is simply a floor for accreditation purposes. Very few schools fail this standard. The statistic, and the cutoff, are designed for a minimal test of whether the law school is functioning appropriately, at a very basic level. (It’s also a bit circular, as I’ve written about—why does the ABA need to accredit schools separate and apart from the bar exam if it’s referring to accreditation standards as passing the bar exam?)

And why is it “critical”?

USNWR gives “full credit” to J.D.-advantage jobs, not simply bar passage-required jobs. That is, its own methodology internally contradicts this conclusion. If ultimately passing the bar is “critical,” then one would expect USNWR to diminish the value of employment outcomes that do not require passing the bar.

Let’s look at some figures, starting with an anecdotal example.

The Class of 2020 at Columbia had a 96.2% ultimate bar passage rate. Pretty good—but good for 53d nationwide. The gap between 100% and 96.2% is roughly the gap between a 172 median LSAT and a 163 median LSAT. You are reading that correctly—this 4-point gap in ultimate bar passage is the same as a 9-point gap at the upper end of the LSAT score range. Or, the 4-point gap is the equivalent to the difference in a peer score of 3.3 and a peer score of 3.0. In other words, it’s a lot.

Now, the 16 students at Columbia (among 423!) who attempted the bar exam once but did not pass it may say something. It may say that they failed four times, but that seems unlikely. It may be they gave up—possible, but why give up? It could be that they found success in careers that did not require bar passage (such as business or finance) and, having failed the bar exam once, chose not to try to take it.

It’s hard to say what happened, and, admittedly, we don’t have the data. If students never take the bar, they are not included in this count. And so maybe there’s some consistency in the “J.D. advantage” category (i.e., passing the bar exam is not required) as a “full credit” position. But for those who opt for such a job, half-heartedly try the bar, fail, and give up—well, they fall out of the “ultimate bar passage” category.

Another oddity is that the correlation between first-time passage rate (that is, over- and under-performance relative to the jurisdiction) and ultimate bar passage rate is good, but at 0.68 one might expect two different bar passage measures to be more closely correlated. And maybe that’s good not to have measures so closely bound with one another. But these are literally both bar passage categories. And they seem to be measuring quite different things.

(Note that including the three schools from Puerto Rico, which USNWR did for the first time this year, distorts this chart.)

You’ll see there’s some correlation, and it maybe tells some stories about some outliers. (There’s a caveat in comparing cohorts, of course—this is the ultimate pass rate for the Class of 2020, but the first-time rate for the Class of 2022.) Take NCCU. It is in a state with a lot of law schools with students with high incoming predictors, whose graduates pass the bar at high rates. NCCU appears to underperform relative to them on the first-time metric. But its graduates have a high degree of success on the ultimate pass rate.

So maybe there’s some value in offsetting some of the distortions for some schools that have good bar passage metrics but are in more competitive states. If that’s the case, however, I’d think that absolute first-time passage, rather than cumulative passage, would be the better metric.

Regardless, I think there’s another unstated reason for using this metric: it’s publicly available. Now that a number of law schools have “boycotted” the rankings, USNWR has had to rely on publicly available data. They took out some factors and they devalued others. But here’s some publicly available data from the ABA. It’s an “output,” something USNWR values more now. It’s about bar passage, which is something it’s already looking at. It’s there. So, it’s being used. It makes more sense than the purported justifications that USNWR gives.

And it’s given 7% in the new rankings. That’s a shocking amount of weight to this metric for another reason: what students actually rely on this figure?

When I speak to prospective law students (whether or not they’re planning to attend a school I’m teaching at), I have conversations about employment outcomes, yes. About prestige and reputation. About cost and about debt. About alumni networks. About geography. About faculty and class size.

In thirteen years of legal education, I’m not sure I’ve ever thought to mention to a student, “And by the way, check out their ultimate bar passage rate.” First time? Sure, it’s happened. Ultimate? Can’t say I’ve ever done it. Maybe that’s just reflecting my own bias. But I certainly don’t intend to start now. If I were making a list of factors I’d want prospective students to consider, I’m not sure “ultimate bar passage rate” would be anywhere on the list.

In any event, this is one of the more bizarre additions to the rankings, and I’m still wrapping my head around it.

Law school faculty have aggressively and successfully lobbied to diminish the importance of law school faculty in the USNWR rankings

In many contexts, there is a concern of “regulatory capture,” the notion that the regulated industry will lobby the regulator and ensure that the regulator sets forth rules most beneficial to the interests of the regulated industry.

In the context of the USNWR law rankings, the exact opposite has happened when it comes to the interests of law school faculty. Whether it has been intentional or inadvertent it hard to say.

It is in the self-interest of law school faculty to ensure that the USNWR law school rankings maximize the importance and influence of law school faculty. The more that faculty matter in the rankings, the better life is for law faculty—higher compensation, more competition for faculty, more hiring, more recognition for work, more earmarking for fundraising, the list goes on.

But in the last few years, law school faculty (sometimes administrators, sometimes not) have pressed for three specific rules that affirmatively diminish the importance of law faculty in the rankings.

First, citation metrics. USNWR suggested in 2019 that it would consider incorporating law school faculty citation metrics into the USNWR law school rankings. There were modest benefits to this proposal, as I pointed out back in 2019. Citation metrics are less “sticky” than peer reputations and may better capture the “influence” or quality of a law faculty.

But the backlash was fierce. Law faculty complained loudly that the citation metrics may not capture everything, may capture it imperfectly, may introduce new biases into the rankings, may create perverse incentives for citations—the list went on and on. USNWR abandoned the plan.

Note, of course, that even an imperfect metric was specifically and crucially tied to law school faculty generally, and law school scholarly productivity particularly. Imperfect as it may have been, it would have specifically entrenched law school faculty interests in the rankings. But law school faculty spoke out sharply against it. It appears that backlash—at least in part—helped drive the decisionmaking about whether it should be used.

Second, expenditures per student. Long a problem and a point of criticism were the expenditures per student. A whopping 9% of the old USNWR measured “direct” expenditures (e.g., not scholarships). That includes law professors’ salaries. The more you spent, the higher you could rise in the rankings.

Expenditures per student was one of the first things identified by “boycotting” schools last fall as a problematic category. And they have a point! The data was not transparent and subject to manipulation. It did not really have a bearing on the “quality” of the student experience (e.g., public schools spent less).

But as I pointed out earlier this year, knocking out expenditures per student kills the faculty’s golden goose. As I wrote:

In the past, law schools could advocate for more money by pointing to this metric. “Spend more money on us, and we rise in the rankings.” Direct expenditures per student—including law professor salaries—were 9% of the overall rankings in the most recent formula. They were also one of the biggest sources of disparities among schools, which also meant that increases in spending could have higher benefits than increases in other categories. It was a source for naming gifts, for endowment outlays, for capital campaigns. It was a way of securing more spending than other units at the university.

. . .

To go to a central university administration now and say, “We need more money,” the answer to the “why” just became much more complicated. The easy answer was, “Well, we need it for the rankings, because you want us to be a schools rated in the top X of the USNWR rankings.” That’s gone now. Or, at the very least, diminished significantly, and the case can only be made, at best, indirectly.

The conversation will look more like, “Well, if you’re valued on bar passage and employment, what are you doing about those?

Again, law faculty led the charge to abolish the expenditures per student metric—that is, chopping the metric that suggested high faculty salaries were both good and should contribute to the rankings.

Third, peer score. Citation metrics, I think, would have been a way to remedy some of the maladies of the peer scores. Peer scores are notoriously sticky and non-responsive to current events. Many law schools with “high” peer scores have them because of some fond recollections of the faculty circa 1998. Others have “low” peer scores because of a lack of awareness of who’s been writing what on the faculty. Other biases may well abound in the peer score.

The peer scores were volatile in limited circumstances. Renaming a law school could result in a huge bounce. A scandal could result in a huge fall—and persist for years.

But at 25% of the rankings, they mattered a lot. And as they were based on survey data from law school deans and faculty, your reputation within the legal academy mattered a lot. And again, I think the bulk of the way faculty valued other law school was mostly their faculty. Yes, I suppose large naming gifts, reports of high bar passage and employment, or other halo effects around the school (including athletics) could contribute. But I think the reputation of law schools among other law schools was often based on the view of the faculty.

Private conversations with USNWR from law faculty and deans over the years, however, have focused criticism on the peer score. Law faculty can’t possibly know what’s happening at 200 schools (but survey respondents have the option of not voting if they don’t know enough). There are too many biases. It’s too sticky. Other metrics are more valuable. My school is underrated. On and on.

Fair enough, USNWR answered. Peer score will be reduced from 25% to 12.5%. The lawyer-judge score will be reduced from 15% to 12.5%—and now equal with peer score.

To start, I doubt lawyers and judges know as much about the “reputation” of law schools. Perhaps they are more inclined to leave more blanks. But the practice of law is often a very regional practice, and one could go a long time without ever encountering a lawyer from any number of law schools. And many judges may have no idea where the litigants in front of them went to law school In contrast, law school faculty and deans know a lot about what’s happening at other law school—giving faculty workshops and talks, interviewing, lateraling, visiting, attending conferences and symposia.

But setting that aside, law faculty were successful. They successfully pressed to diminish the peer score, which was a mechanism for evaluating the quality of a law school, often based on the quality of faculty. Back to the golden goose, as I noted earlier:

And indirectly, the 40% of the formula for reputation surveys, including 25% for peer surveys and 15% for lawyer/judge, was a tremendous part of the formula, too. Schools could point to this factor to say, “We need a great faculty with a public and national reputation, let us hire more people or pay more to retain them.” Yes, it was more indirect about whether this was a “value” proposition, but law faculty rating other law faculty may well have tended to be most inclined to vote for, well, the faculty they thought were best.

Now, the expenditure data is gone, completely. And peer surveys will be diminished to some degree, a degree only known in March.

*

Maybe this was the right call. Certainly for expenditure data, I think it was a morally defensible—even laudable—outcome. For the citation data and the peer score, I am much less persuaded that opposition was the right thing or a good thing. There are ways of addressing the weaknesses in these areas without calling for a reduction in weight or impact, which, I think, would have been preferable.

But instead, I want to make this point. One could argue that law school faculty are entirely self-interested and self-motivated to do whatever possible to ensure that they, as faculty, will receive as much security, compensation, and accolades as possible. Entrenching those interests in highly-influential law school rankings would have been a way to do so.

Yet in three separate cases, law faculty aggressive lobbied against their own self interest. Maybe that’s because they viewed it as the right thing to do in a truly altruistic sense. Maybe because they wanted to break any reliance on USNWR or make it easier to delegitimize them. Maybe it was a failure to consider the consequences of their actions. Maybe my projections about the effect that these criteria have on faculty are simply not significant. I’m not sure.

In the end, however, we have a very different world from where we might have been five years ago. Five years ago, we might have been in a place where faculty publications and citations were directly rewarded in influential law school rankings; where expenditures on faculty compensation remained rewarded in those rankings; and where how other faculty viewed you was highly regarded in those rankings. None of that is true today. And it’s a big change in a short time.

Projecting the 2024-2025 USNWR law school rankings (to be released March 2024 or so)

Fifty-eight percent of the new USNWR law school rankings turn on three highly-volatile categories: employment 10 months after graduation, first-time bar passage, and ultimate bar passage.

Because USNWR releases its rankings in the spring, at the same time the ABA releases new data on these categories, the USNWR law school rankings are always a year behind. This year’s data include the ultimate bar passage rate for the Class of 2019, the first-time bar passage rate for the Class of 2021, and the employment outcomes of the Class of 2021.

We can quickly update all that data with this year’s data—Class of 2020 ultimate bar passage rate, Class of 2022 first-time bar passage, and Class of 2022 employment outcomes (which we have to estimate and reverse engineer, so there’s some guesswork). Those three categories are 58% of next year’s rankings.

And given that the other 42% of the rankings are much less volatile, we can simply assume this year’s data for next year’s and have, within a couple of ranking slots or so, a very good idea of where law schools will be. (Of course, USNWR is free to, and perhaps likely to (!), tweak its methodology once again next year. Some volatility makes sense, because it reflects responsiveness to new data and changed conditions; too much volatility tends to undermine the credibility of the rankings as it would point toward arbitrary criteria and weights that do not meaningfully reflect changes at schools year over year.) Some schools, of course, will see significant changes to LSAT medians, UGPA medians, student-faculty ratios, and so on relative to peers. And the peer scores may be slightly more volatile than years past if schools change their behavior yet again.

But, again, this is a first, rough cut of what the new (and very volatile) methodology may yield. (It’s also likely to be more accurate than my projections for this year, which involved significant guessing about methodology.) High volatility and compression mean bigger swings in any given year. Additionally, it means that smaller classes are more susceptible to larger swings (e.g., a couple of graduates whose bar or employment outcomes change are more likely to change the school’s position than larger schools).

Here’s the early projections. (Where there are ties, they are sorted by score, which is not reported here.)

School Projected Rank This Year's Rank
Stanford 1 1
Yale 2 1
Chicago 3 3
Harvard 4 5
Virginia 4 8
Penn 6 4
Duke 6 5
Michigan 8 10
Columbia 8 8
Northwestern 10 10
Berkeley 10 10
NYU 10 5
UCLA 13 14
Georgetown 14 15
Washington Univ. 14 20
Texas 16 16
North Carolina 16 22
Cornell 18 13
Minnesota 19 16
Vanderbilt 19 16
Notre Dame 19 27
USC 22 16
Georgia 23 20
Boston Univ. 24 27
Wake Forest 24 22
Florida 24 22
Texas A&M 27 29
Utah 28 32
Alabama 28 35
William & Mary 28 45
Boston College 31 29
Ohio State 31 22
Washington & Lee 31 40
Iowa 34 35
George Mason 35 32
Indiana-Bloomington 35 45
Florida State 35 56
Fordham 35 29
BYU 39 22
Arizona State 39 32
Baylor 39 49
Colorado 39 56
George Washington 39 35
SMU 39 45
Irvine 45 35
Davis 46 60
Illinois 46 43
Emory 46 35
Connecticut 46 71
Washington 50 49
Wisconsin 50 40
Tennessee 52 51
Penn State-Dickinson 52 89
Villanova 52 43
Temple 52 54
Kansas 52 40
Penn State Law 57 80
San Diego 57 78
Pepperdine 57 45
Cardozo 60 69
Missouri 60 71
UNLV 60 89
Kentucky 60 60
Oklahoma 60 51
Loyola-Los Angeles 65 60
Wayne State 65 56
Northeastern 65 71
Arizona 68 54
Drexel 68 80
Richmond 68 60
Maryland 68 51
Seton Hall 72 56
St. John's 72 60
Cincinnati 72 84
Tulane 72 71
Nebraska 72 89
Loyola-Chicago 77 84
Georgia State 77 69
South Carolina 77 60
Houston 77 60
Florida International 77 60
UC Law-SF 82 60
Drake 82 88
Maine 82 146
Marquette 85 71
Catholic 85 122
LSU 85 99
Pitt 85 89
New Hampshire 85 105
Denver 90 80
Belmont 90 105
Lewis & Clark 90 84
New Mexico 93 96
UMKC 93 106
Regent 93 125
Oregon 93 78
Texas Tech 97 71
Case Western 97 80
Dayton 97 111

UPDATE July 2023: Due to an error on my part, some data among schools with “S” beginning in their name was transposed in some places. Additionally, some other small data figures have been corrected and cleaned up. The data has been corrected, and the chart has been updated.