Back in December, I wondered about the “endgame” for law schools purporting to “boycott” the USNWR law school rankings. I noted one effort may be to delegitimize the rankings. Another was to change the methodology, but that seemed questionable:
So, second, persuade USNWR to change its formula. As I mentioned in the original Yale and Harvard post, their three concerns were employment (publicly available), admissions (publicly available), and debt data. So the only one with any real leverage is debt data. But the Department of Education does disclose a version of debt metrics of recent graduates, albeit a little messier to compile and calculate. It’s possible, then, that none of these three demanded areas would be subject to any material change if law schools simply stopped reporting it.
Instead, it’s the expenditure data. That is, as my original post noted, the most opaque measure is the one that may ultimately get dropped if USNWR chooses to go forward with ranking, it would need to use only publicly-available data. It may mean expenditure data drops out.
Ironically, that’s precisely where Yale and Harvard (and many other early boycotters) excel the most. They have the costliest law schools and are buoyed in the rankings by those high costs.
So, will the “boycott” redound to the boycotters’ benefit? Perhaps not, if the direction is toward more transparent data.
USNWR has announced dramatic changes to its methodology. The weight of inputs (including admissions figures) will be decreased significantly. The weight of outputs will be increased significantly. And reliance on non-public data (like expenditures) will disappear.
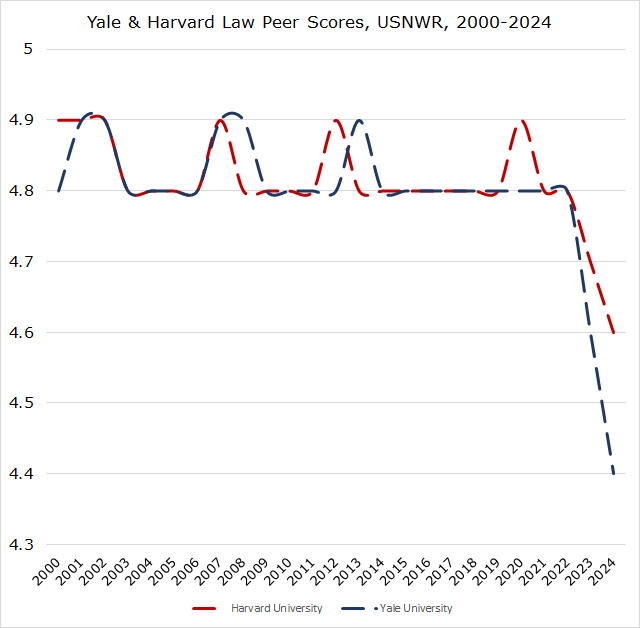
As I noted last December, it was not likely that the changes in methodology to more transparent data or away from certain categories would redound to the benefit of some of these boycotting law schools. Harvard, which has dropped to 5 this year, has experienced it. Yale, which I anticipate will drop to 4 next year (more on that in a future post), is another.
In other words, it’s not clear that the boycott benefited the initiating schools and appears to have harmed their competitive advantage.
But I get ahead of myself.
The changes are significant. You can read about them here. There are reasons to think the changes are good, bad, or mixed, but that’s not what I want to focus on for the moment. I want to focus on the effect of the changes.
The changes move away from the least volatile metrics toward the most volatile metrics. Some volatility is because of compression—some metrics are very compressed and even slight changes year to year can affect the relative positioning of schools. Some of the volatility is because of the nature of the factors themselves—a handful of graduates who fail or pass the bar, or who secure good jobs or who end up unemployed, are much more likely volatile outcomes on a year-to-year basis than changes in admissions statistics.
Expenditures per student, now eliminated from the rankings, were not very volatile because there was a huge spread between schools and the schools remained roughly in place each year—it’s very hard to start miraculously spending an extra $20,000 per student per year, and any marginal increase each year was often offset by everyone else’s marginal increases. Additionally, the vast spread in Z-scores made law schools uniquely situated to spread themselves (especially at the top), which could drown out much of the movement in other factors the rankings.
In employment, there is tremendous compression near the top of the rankings in particular. The difference between 99% employed and 97% employed can mean a a rankings change of 15 spots; from 90% to 87% can be 50 spots for the Class of 2021. (These percentages are also influenced in how USNWR weighs various sub-categories of employment, too.) (Additionally, I was right last month that law schools misunderstood the employment metrics—essentially nothing changed for most schools, although a couple of outliers lower in the rankings saw their position improve markedly, likely due to USNWR data entry errors—the rankings were closer to my original projections that I got from ABA data.)
And, some metrics simply don’t change much year to year. Let’s just briefly look at the correlation between some figures from the 2023 and 2024 data that have decreased in weight.
Peer assessment score (weight decreased from 25% to 12.5%): 0.996
Lawyer/judge assessment score (weight decreased from 15% to 12.5%): 0.997
Median LSAT score (weight decreased from 11.25% to 5%): 0.993 (Strictly speaking, law schools are ranked on a composite of their GRE and LSAT medians, but this captures the vast amount of the rankings factor.)
Median UGPA (weight decreased from 8.75% to 4%): 0.965
These four categories have dropped from a combined 60% of the rankings to 29%—and these four were remarkably stable year to year.
And now to the correlation between some figures from the 2023 and 2024 data that have increased in weight:
First-time bar passage (weight increased from 3% to 18%): 0.861
10-month employment outcomes (weight increased from 14% to 33%): 0.809
These two categories alone have gone from 17% of the rankings to 51% of the rankings—and these are much more volatile.
We can compare the spread of schools from top to bottom, visualizing them by their overall “score.” (I’ve done this before, including last year.) We can see a dramatic compression in the scores these schools received that form the basis of their ultimate ranking. This compression is the result of two decisions by USNWR.
First, USNWR has increased categories that are much more compressed (e.g, employment) rather than the ones that were much more spread out (e.g., expenditures). (Of course, USNWR eliminated non-public data like expenditures as a result of the law schools’ “boycott,” which deprived USNWR of non-public data like this.)
Second, it has added Puerto Rico’s three schools to the rankings. While this may not seem like a big deal, it is a huge deal if you are putting all the schools on a 0-100 scoring spectrum.
One school, Pontifical Catholic University of Puerto Rico, is so far below every other school that it singularly distorts the scale for everyone. Its median LSAT score is a 135, which is roughly in the 4th percentile of LSAT test-takers (the next lowest is 143 at Inter-American, another Puerto Rican law school, which is roughly the 21st percentile). Only 19% of its graduates secured full-time, long-term, bar passage-required or JD-advantage jobs (the next lowest is Inter-American at 37%). And these law schools have long had challenges retaining ABA accreditation with their bar exam pass rates. This is not to pick on one law school—it is simply to note its numbers compared to the rest.
In past years, the gap between the “worst” and “second-worst” school in these metrics was relatively close, so the 0-100 scale showed some appropriate breadth—the bottom school might be a 0, but the next closest school would be a 3, and the next a 5, and so on upward. (While USNWR does not publicly disclose the scores of schools near the bottom of the rankings, it does not take much effort to reverse engineer the rankings, as I was doing earlier this year, to see where schools fall.) This year, however, the gap between the “worst” and “second-worst” school is significantly larger, which means no one is close to the school that scores 0. And again, standardizing on a 0-100 scale means more compression for 195 schools, followed by a gap ahead of the 196th school—it effectively converts a 0-100 scale into something like a 15-100 or 20-100 scale. This compression creates more ties in the ordinal rankings.
Let me offer a brief visualizing of, say, the top ~60 schools, this year and last year. This is not an optical illusion. There are about 60 schools on each side of the visualization.

